Study Material for Physics Lab
by Sanatan Halder (PhD, IIT Kanpur)
Online version (html) of this study material is hosted on https://sanatanhalder.github.io/phylab
Introduction
Welcome to Study Material for Physics Lab, an introductory study material made by Sanatan Halder (PhD, IIT Kanpur)
This material is prepared in terms of simplicity and readability to teach ug students who need help understanding the lab manual. Each experiment is divided into five sections: theory, apparatus, flowchart for experimenting, experimental data, and error analysis.
ℹ️ This study material only provides material for the prism spectrometer as of August 2023.
Prism Spectrometer
by Sanatan Halder (PhD, IIT Kanpur)
Prism Spectrometer consists of a glass prism of triangular cross-section and a table spectrometer. Using these instruments, one can find the refractive index of glass material for different wavelengths of light.

Figure 2.0-1: Prism Spectrometer Experimental Setup
Theory
Cauchy's equation
The refractive index of an optically transparent material depends on the wavelength of the light. The dependence can be written as
or,
where is known as coefficient of refraction and is known as coefficient of dispersion.
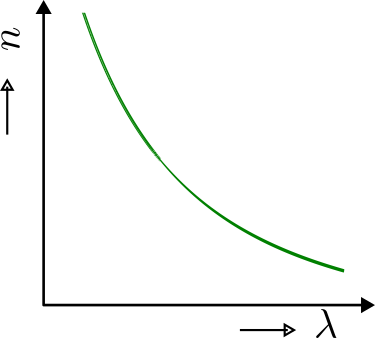
Figure 2.1-1: Cauchy's Dispersion Graph
Snell's formula
When the angle of incidence becomes equal to the angle of emergence, i.e. , deviation becomes minimum . Also satisfying and .
If angle of the prism is known, then by knowing angle of minimum deviation , the refractive index can be found by Snell's formula,
Where is the angle of prism and is the angle of minimum deviation.
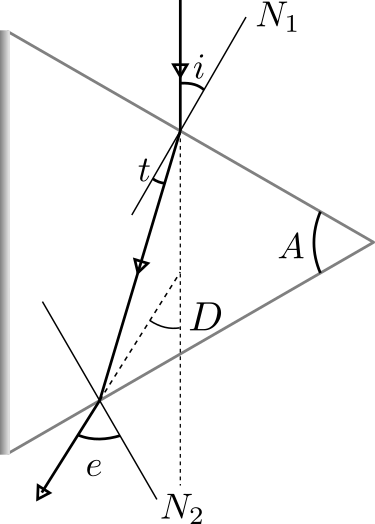
Figure 2.1-2: Ray diagram
Dispersive power
Apparatus
Light Source
The Mercury light bulb is placed inside a black box with a small vertical slice opening.
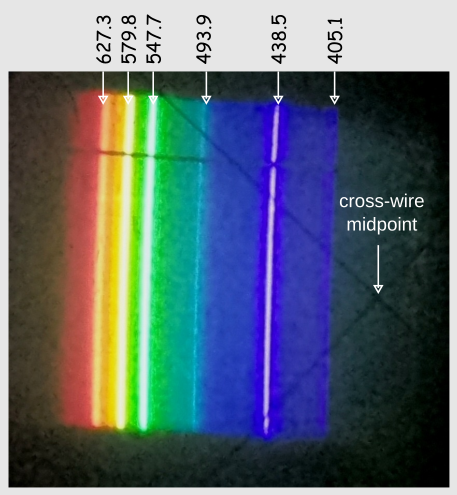
Figure 2.2-1: Spectrum of the mercury light when viewed from glass prism.
Prism Glass
As the name suggests, it is made of glass with two refracting surfaces where light can be transmitted and one `rough surface`` where light gets scattered or absorbed.
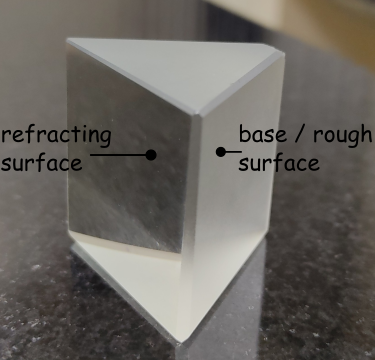
Figure 2.2-2: Prism glass
Spectrometer
A spectrometer consists of four components: collimator, telescope, prism table, and vernier table.
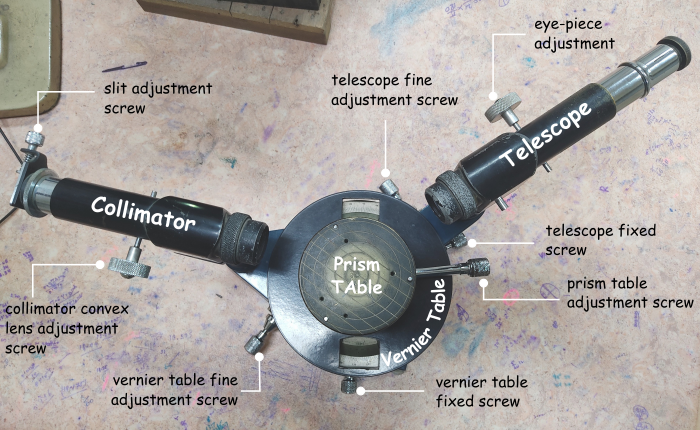
Figure 2.2-2: Spectrometer
Additional Components
Water label, small rod for tightening spectrometer parts.
Flowchart
This is the main flowchart that you must follow.
-
Level the telescope, collimator, and prism table by a spirit level.
-
Check the direct white light from the telescope, adjust the slit width placed in front of the collimator so that the vertical line becomes narrower, then focus by adjusting the telescope's eye-piece knob. You can also use the collimator adjusting knob for focusing when telescope eye-piece adjustment is insufficient.
-
Place the prism such that it's one refracting surface facing the light coming from the collimator and another surface facing the telescope or you. Don't put the prism such that the prism's base blocks the light path.
-
First, try to detect the visible spectrum from your naked eye, then bring the telescope to that point and try to see from the telescope. If the image gets blurred, make eye-piece adjustments for a sharper image.
-
Now, the telescope is not at the same place when you tried to get white vertical line without placing the prism on the prism table, Right? So that means light gets deviated when you put the prism glass. Now you are at some unknown deviation point. We can't proceed with this angle of deviation; we need angle of minimum deviation . Then, only we can apply Snell's equation to get the refractive index for different colors of light.
-
We need to make the angle of incidence equal to the angle of emergent, i.e., to get the minimum deviation position. So, we will rotate the prism to make . Here, we will not rotate the prism; instead, we will rotate the prism table for smooth movement.
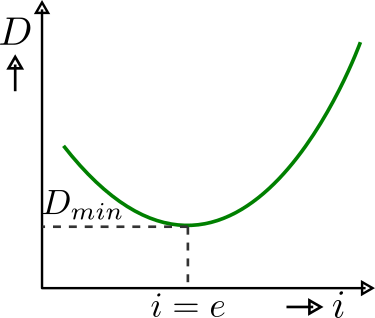
Figure 3.3-1: Angle of deviation with angle of incidence. -
Find minimum deviation point:For the timing, we will not disturb the telescope and only observe through it by rotating the prism table clockwise and anti-clockwise. In clockwise or anti-clockwise direction (we can't predict which direction we can get the minimum; it all depends on prism orientation), all the lines will be out of the field and will not be any return of the spectrum. So, that means that direction will not have the minimum deviation point. Now, we will rotate anti-clockwise (if previously was clockwise) or clockwise (if previously was anit-clockwise); at this time, all the spectrum will return to the telescope view, and we will keep rotating in that direction. At some point, movement of the spectrum will turn its directions, i.e., if it was going left to right then at that point, it will turn back and will move opposite means right to left (for right to left it will turn from left to right). If you observe this interesting turning of spectrum movement, then you are almost done finding the minimum deviation. So to set the prism at you have to stop rotating the prism table when the turn occurs.

Figure 3.3-2: Telescope view with changing the prism orientation. -
Now, you will see the spectrum has slightly shifted from the telescope view, either left or right. Since we will start taking reading from red, we will move the telescope cross-wire on the red line. You can use fine adjustment to move the telescope position slowly; in that case, you need to lock the telescope by the knob.
NB: If you are wearing blue light protected glass, you can't see the blue line properly. So, to see the blue line of the spectrum, you need to take out your glass and see from your eye. You can get a blurred image since you are not using glass, but don't worry, we have eye-piece try to adjust that to get a sharp image.
Experimental Data
Angle of prism (given)
Calculation of least count or vernier constant
From below image of vernier scale you can see that length of 30 lines of vernier scale matches with the lenght of 29 lines of main scale
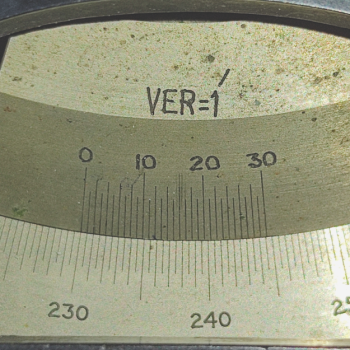
Figure 2.4-1: vernier scale
So, least count .
How to take reading
Vernier reading is your reference point. First determine at what point vernier cross the main scale reading. Then you will look for the verner reading and that is the reading where a particular line from vernier scale perfectly coincides with any of the main scale reading. Let's see an example below
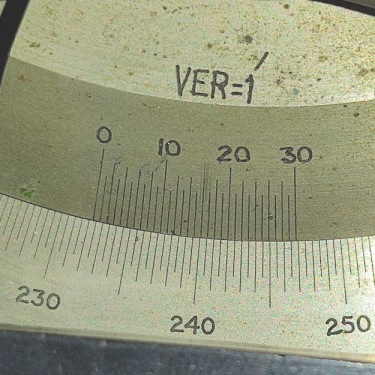
Figure 2.4-2: Reading at some deviation point
For this case and . So, total reading
Table - I
Measurement of anlge of minimu deviation
| Sr. No. | with prism | without prism | Angle of minium deviation | |
|---|---|---|---|---|
| 1 | 627.3 | ... | ... |
NB: With prism reading either can increase or decrease depending on your telescope orientation, but the angle of minimum deviation should always increase from red to violet.
Table - II
Calculation of refractive index
| Sr. No. | ||||
|---|---|---|---|---|
| 1 | 627.3 | ... | ... |
NB: Calculate the values for atleast three decimal places.
Graph plotting
Recall the Cauchy's equation,
we will plot graph, i.e it will be a straight line where , , and .
Some suggestions for plotting a proper graph
- You should utilize all the space in your graph. for x-axis: start from then after 20 small squares mark and so on. Your scale division along x axis will become . It would be best to take care of your y-axis because it differs from each group and depends on how good your data points are.
- You should draw a best-fitted graph; the criteria are it should pass through the centroid, and the curve to data points distance should be minimal.
- Write the graph's title, and remember to label the axes.
- Draw a bigger triangle for slope calculations, label the triangle vertices by P, Q, and R, and calculate PQ and QR length by counting how many small lines it covers multiplied by scale division along that axis.
Calculate , and
Since we have started x-axis from not from , so we will not have intercept at point. But we can calculate the intercept by putting the centroid value and and slope [from graph] in the straight line equation.
and, once you got you can calculte
for, use the expression and put the refractive index values from Table - II.
Error Calculation
Error in
We will calculate the error of considering Snell's formula because we used it in Table - II for calculating for different light colors.
take log both sides and differentiate
Since is given as a known quantity, we can take its error , so the final expression becomes
is the difference between two readings so that we can get two errors from two different readings, so
Find the error in the refractive index for only red color, i.e .
NB Remember that for error in , you also need to calculate and , so if you are not running out of time and think that you can do all the calculation then find the error for them, if not then skip this part for the time being.
Error in
Since is the intercept of graph, the error of can be taken as the smallest division in y-axis.
Error in
where
is the no of data points.
Error in
As per 2023-24 sem - I, error in is not necessary.
Contributing
Study Material for Physics Lab is free and open source, and the source code is available on Github. If you would like to contribute, see the developer guide and feel accessible to open a pull request