Experimental Data
Angle of prism (given)
Calculation of least count or vernier constant
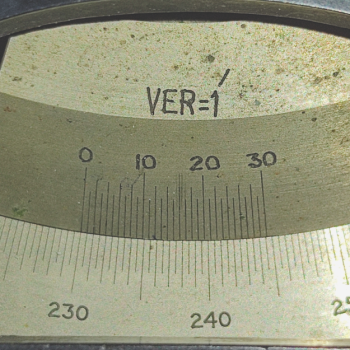
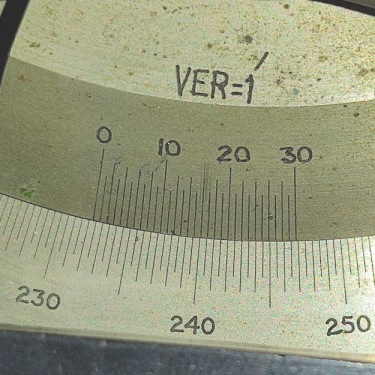
From below image of vernier scale you can see that length of 30 lines of vernier scale matches with the lenght of 29 lines of main scale

Figure 2.4-1: vernier scale
So, least count .
How to take reading
Vernier reading is your reference point. First determine at what point vernier cross the main scale reading. Then you will look for the verner reading and that is the reading where a particular line from vernier scale perfectly coincides with any of the main scale reading. Let's see an example below

Figure 2.4-2: Reading at some deviation point
For this case and . So, total reading
Table - I
Measurement of anlge of minimu deviation
| Sr. No. | with prism | without prism | Angle of minium deviation | |
|---|---|---|---|---|
| 1 | 627.3 | ... | ... |
NB: With prism reading either can increase or decrease depending on your telescope orientation, but the angle of minimum deviation should always increase from red to violet.
Table - II
Calculation of refractive index
| Sr. No. | ||||
|---|---|---|---|---|
| 1 | 627.3 | ... | ... |
NB: Calculate the values for atleast three decimal places.
Graph plotting
Recall the Cauchy's equation,
we will plot graph, i.e it will be a straight line where , , and .
Some suggestions for plotting a proper graph
- You should utilize all the space in your graph. for x-axis: start from then after 20 small squares mark and so on. Your scale division along x axis will become . It would be best to take care of your y-axis because it differs from each group and depends on how good your data points are.
- You should draw a best-fitted graph; the criteria are it should pass through the centroid, and the curve to data points distance should be minimal.
- Write the graph's title, and remember to label the axes.
- Draw a bigger triangle for slope calculations, label the triangle vertices by P, Q, and R, and calculate PQ and QR length by counting how many small lines it covers multiplied by scale division along that axis.
Calculate , and
Since we have started x-axis from not from , so we will not have intercept at point. But we can calculate the intercept by putting the centroid value and and slope [from graph] in the straight line equation.
and, once you got you can calculte
for, use the expression and put the refractive index values from Table - II.